
Regression and Classification with Housing Data

For this project I used housing sales data from Ames, Iowa. This project had three objectives:
1. Predict selling house prices
2. Identify characteristics of houses that one can cost effectively renovate
3. Predict abnormal house sales
The analysis will assist in identifying houses that are likely to sell for more than the cost of the purchase plus renovations. The data set provided was quite rich with many features identifying different aspects of each property sold.
After loading and cleaning the data I began by identifying key features that would reflect house prices. The key features I used were:
- Lot Area
- Square Footage
- Year Built
- Year Renovated
- Unfinished Basement
- Building Type
Using a pair-plot from the seaborn library we can see if there are any trends below.
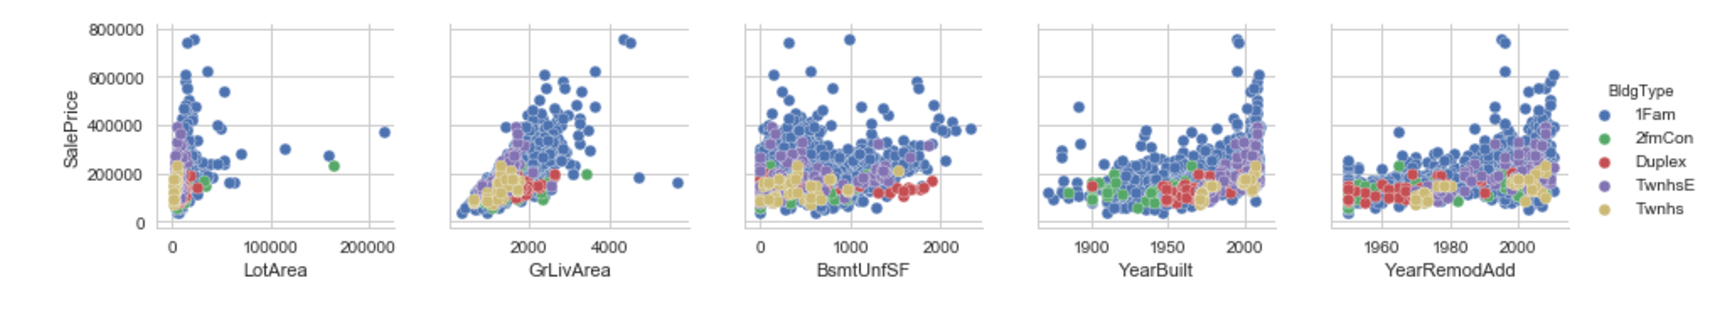
By grouping the houses by building type we can better identify trends to create a model prediction.
Let’s just have a quick look at a histogram of the square footage.
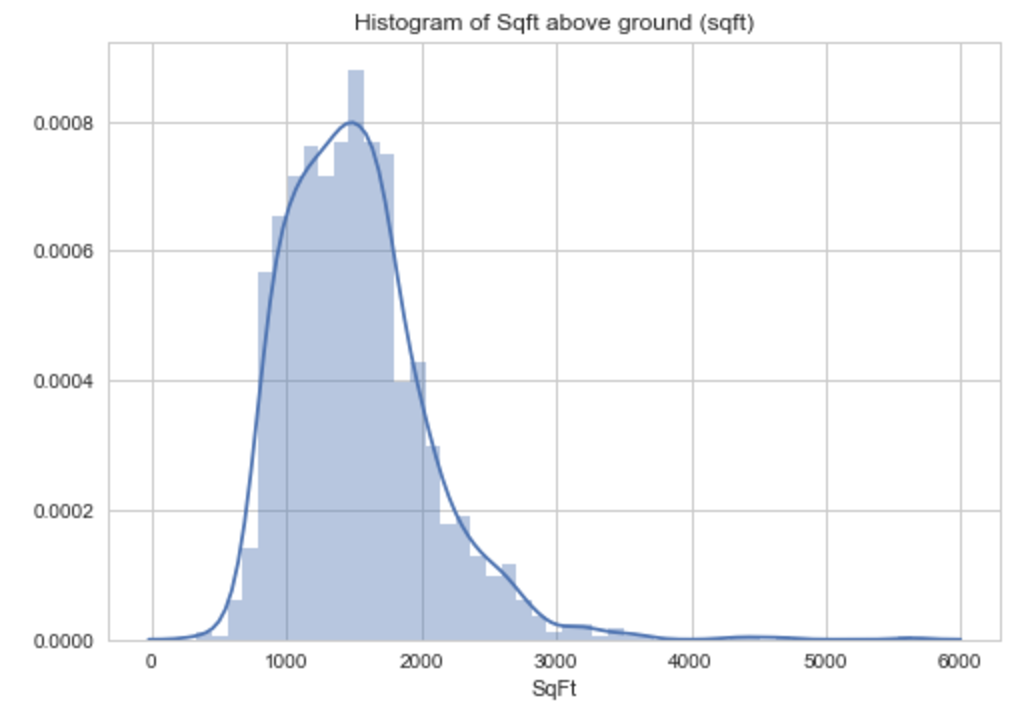
Everything looks ok so we can now proceed and do a model prediction. For this prediction I decided to use a multi-linear regression using stats model. You can use sci-kit learn as well however I liked stats model for this application because of the extra outputs. See below:

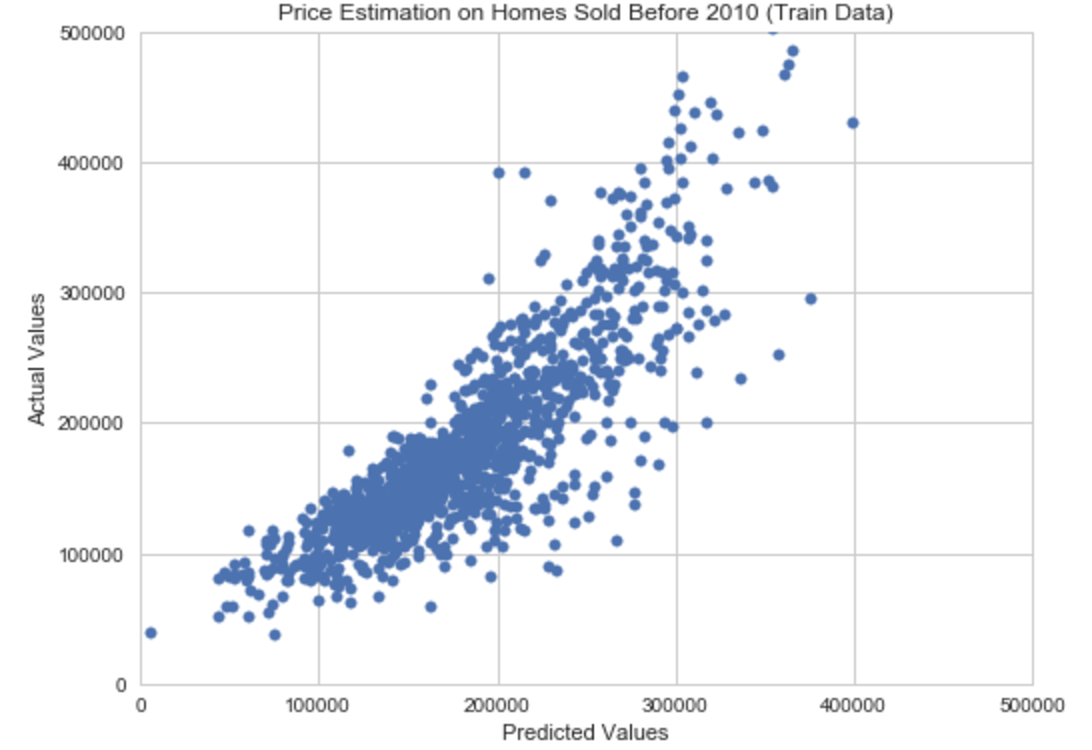
Based on fixed inputs the training dataset is doing quite well with the prediction. If I had more time I would probably try elastic net to see if there is any improvement on the prediction. Overall I am pretty happy with my prediction for the following reasons:
- R-squared > 0.94
- P values < 0.05
- Standard error for each element is pretty low
- My prediction error indicates I am over predicting house price by $2152.
Determining Value of Changeable Property Characteristics
My methodology is to calculate the dollar per sqft for all renovated and non renovated houses. Then compare average between the two subsets to get an idea of the incremental uptick when renovating. As a start let’s look at the dollar/sqft values when grouped by ‘OverallCond’.
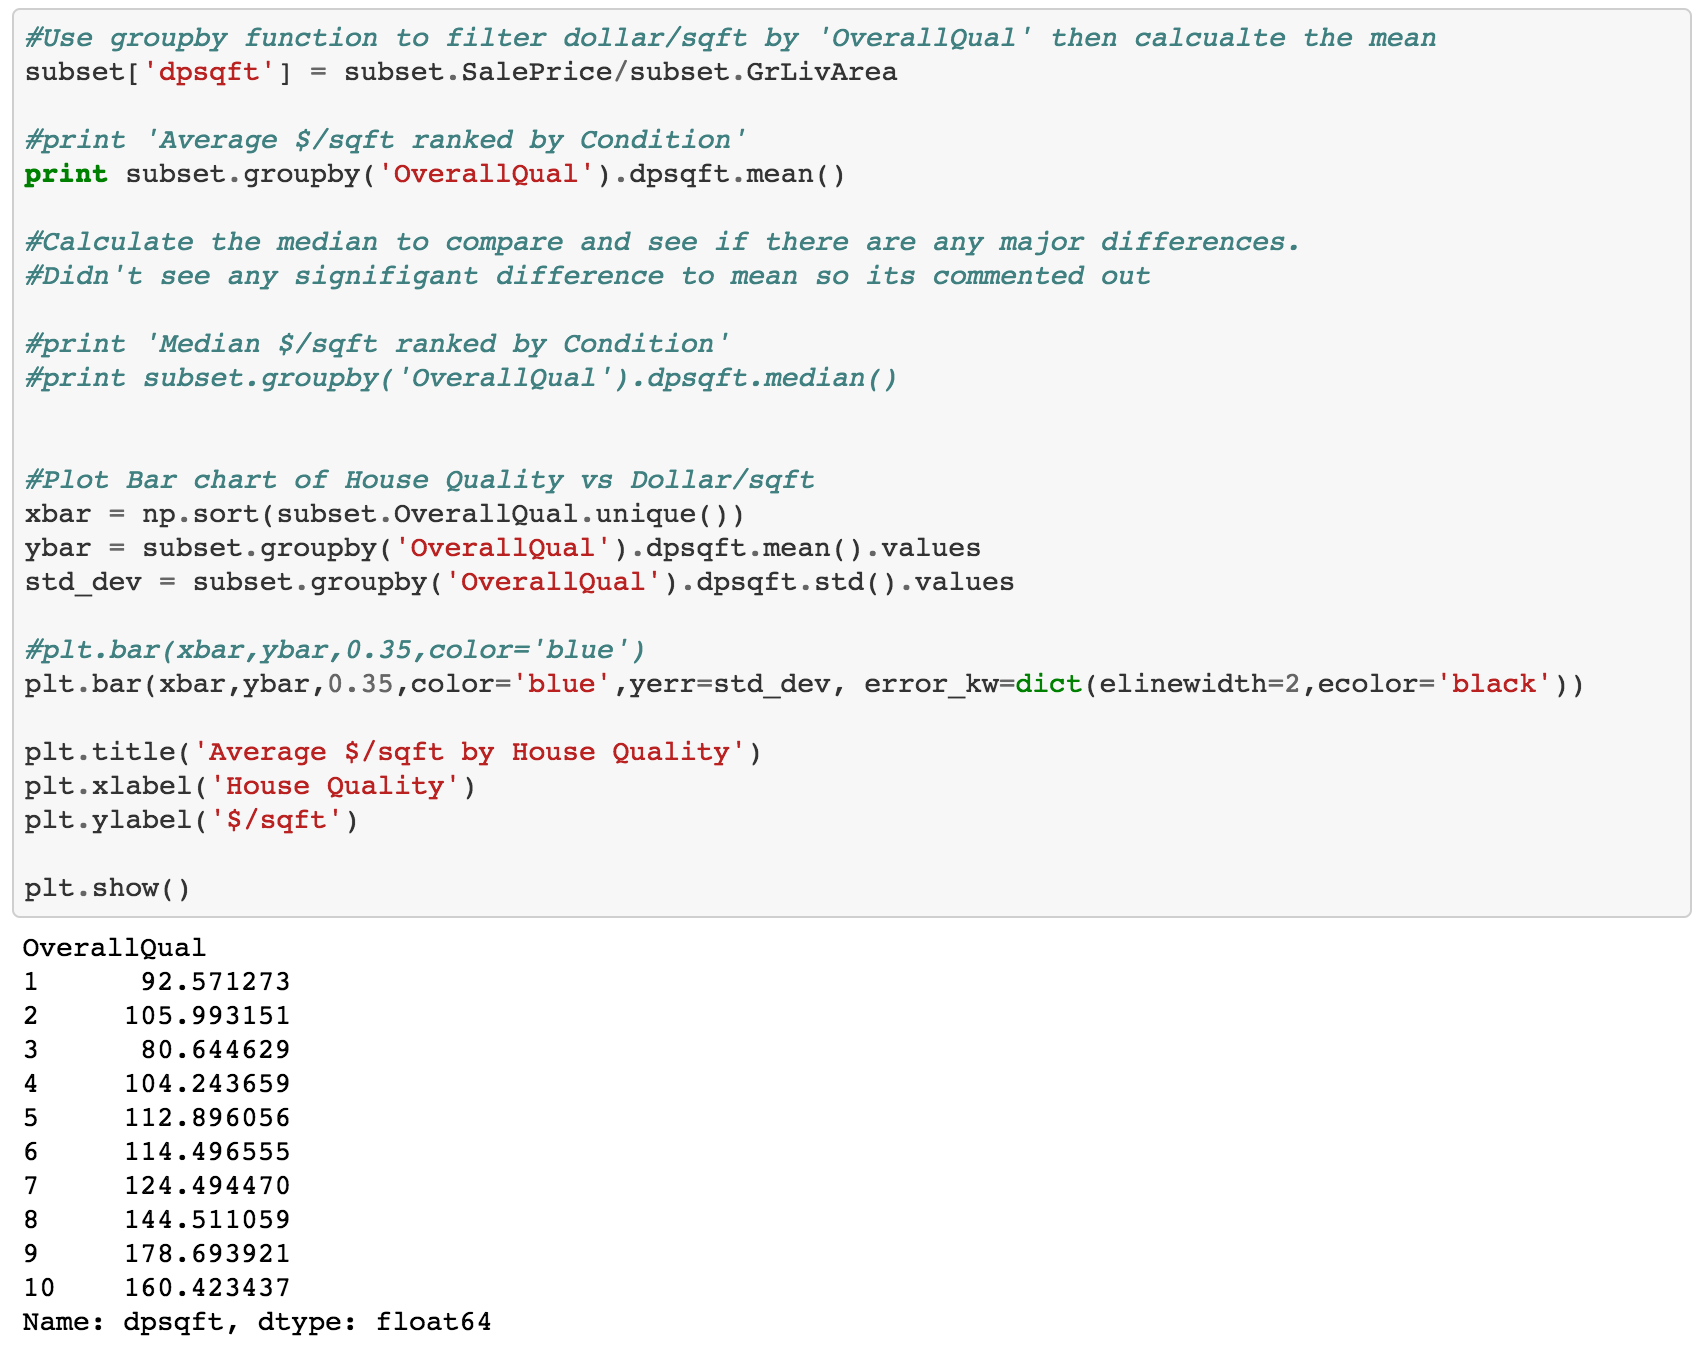
Now’s let’s visualize this on a bar plot.
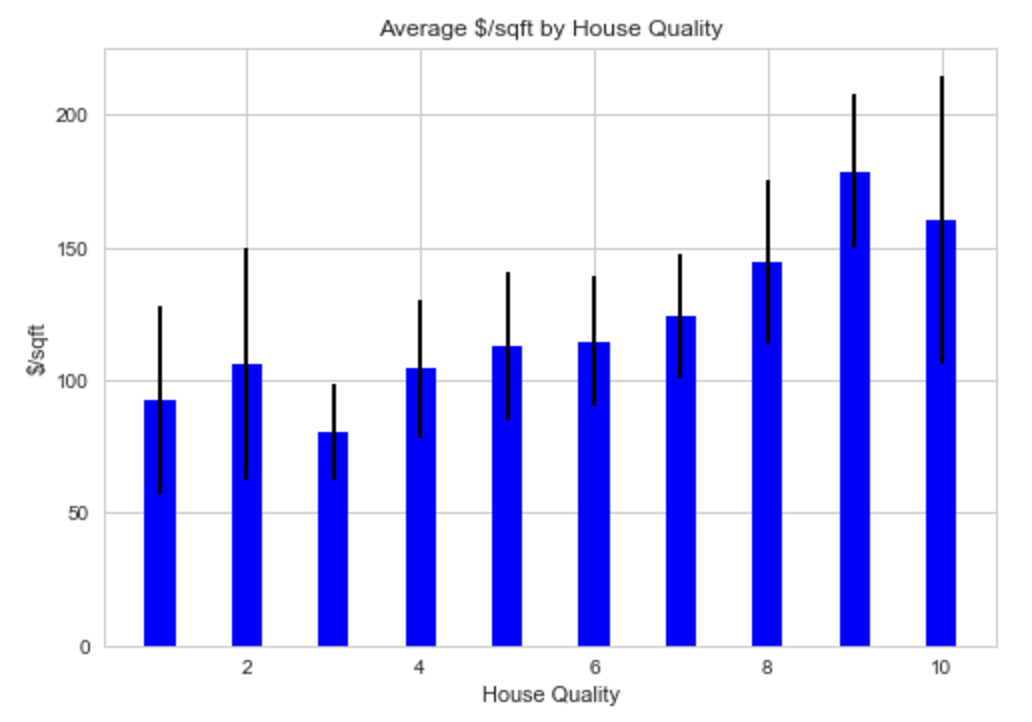
The calculation and bar chart above suggests that the house quality representing the best value for home renovation are those in category -3 -8
By renovating to improve just one category one would expect an average improvement of around $27-$34 per sqft.
Alternatively if your house was ranked in category 4,5,6 or 7 there is very little improvement from one category to another. So one would have to improve at least two categories to see any real value of a renovation. Something that needs more work with this philosophy is the error bars associated with each category and the amount of effort required to renovate. It’s entirely possible that the effort level required to renovate to improve one category is the same as moving up 3 categories.
Using the information above I would target houses in category 3 that have an average dollar/sqft value less than the $80/sqft. These houses would represent the greatest renovation potential with the lowest risk.
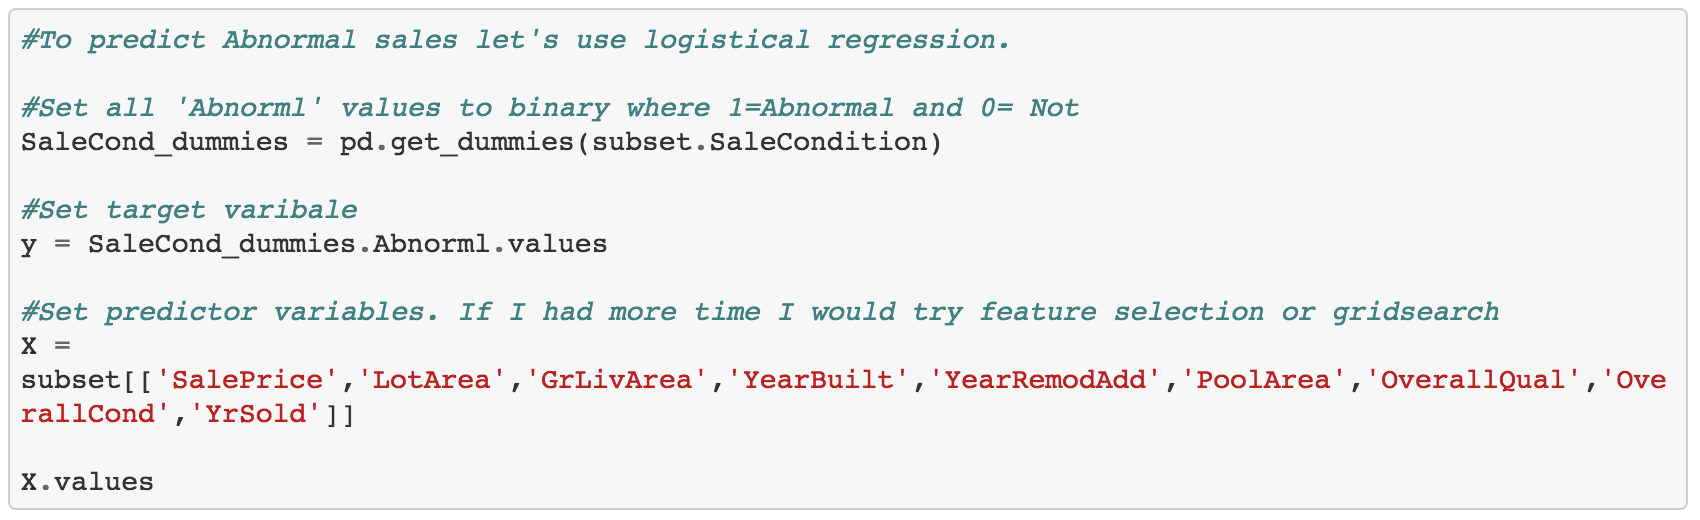
Predicting Abnormal House Sales
One motivating factor to identify abnormal house sales is to be one of the first to move on a property with the ability to purchase for a price lower than market rate.
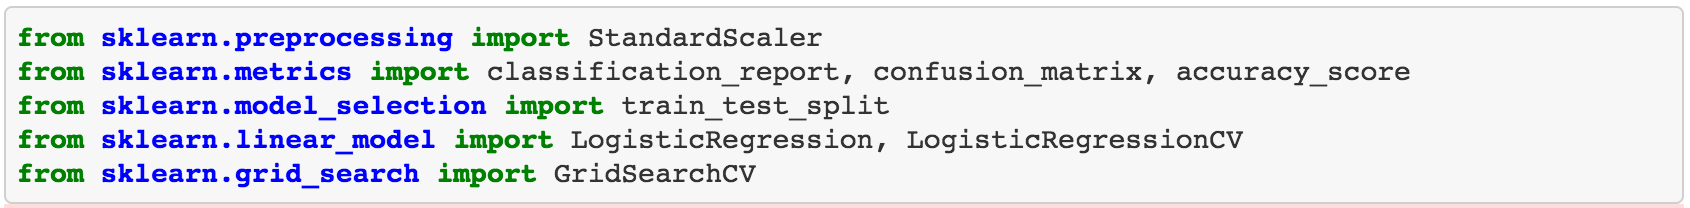
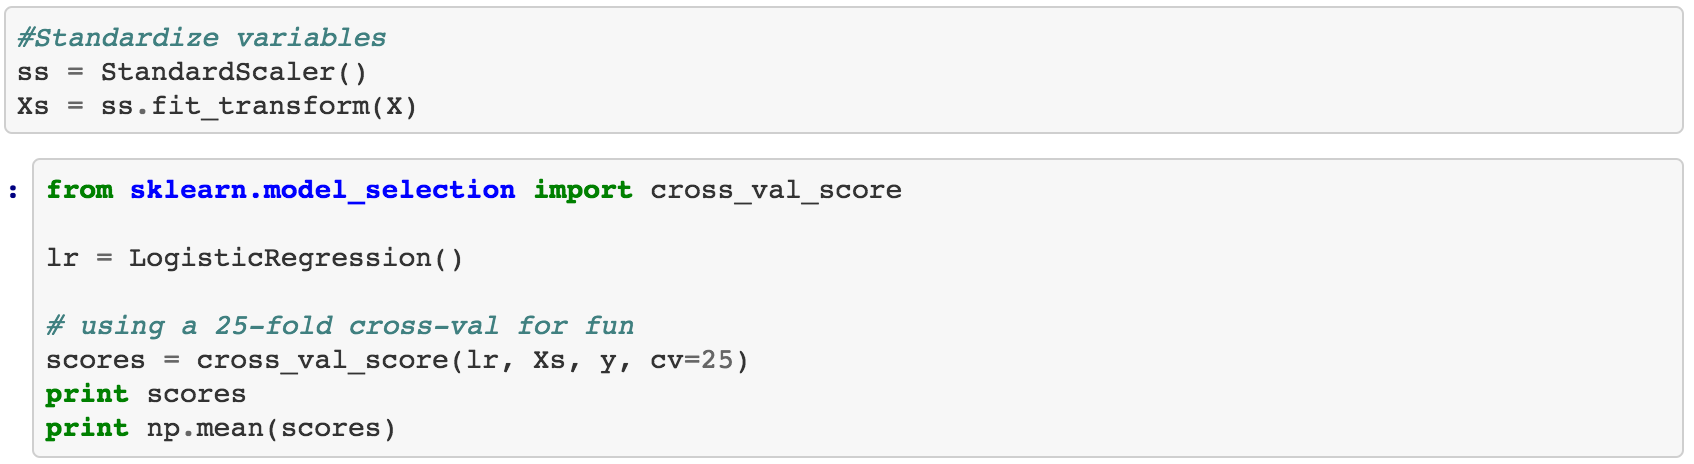
For this example we will first try a logistic regression. Coding below:
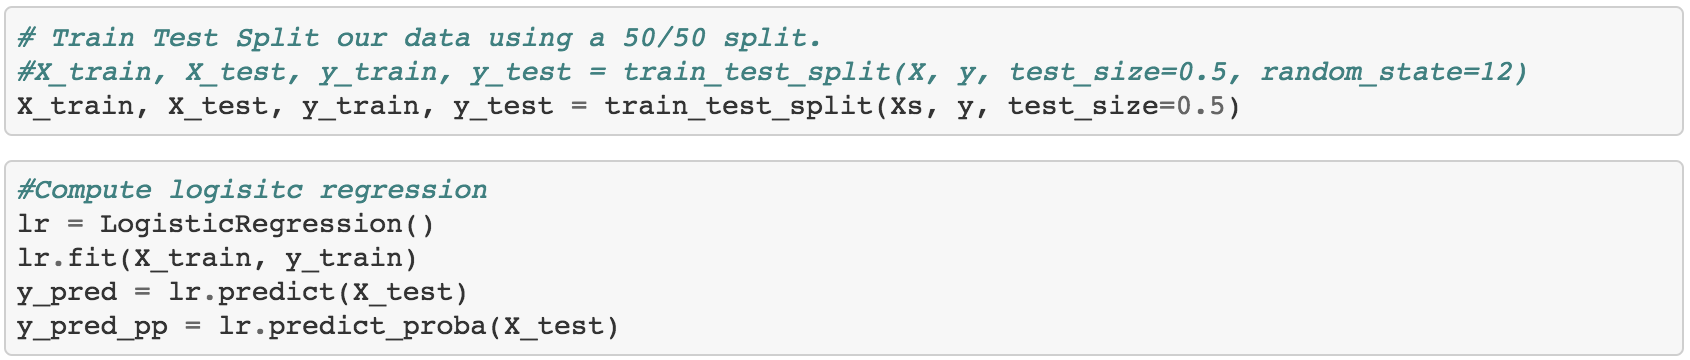
Now let’s build a confusion matrix to see the results
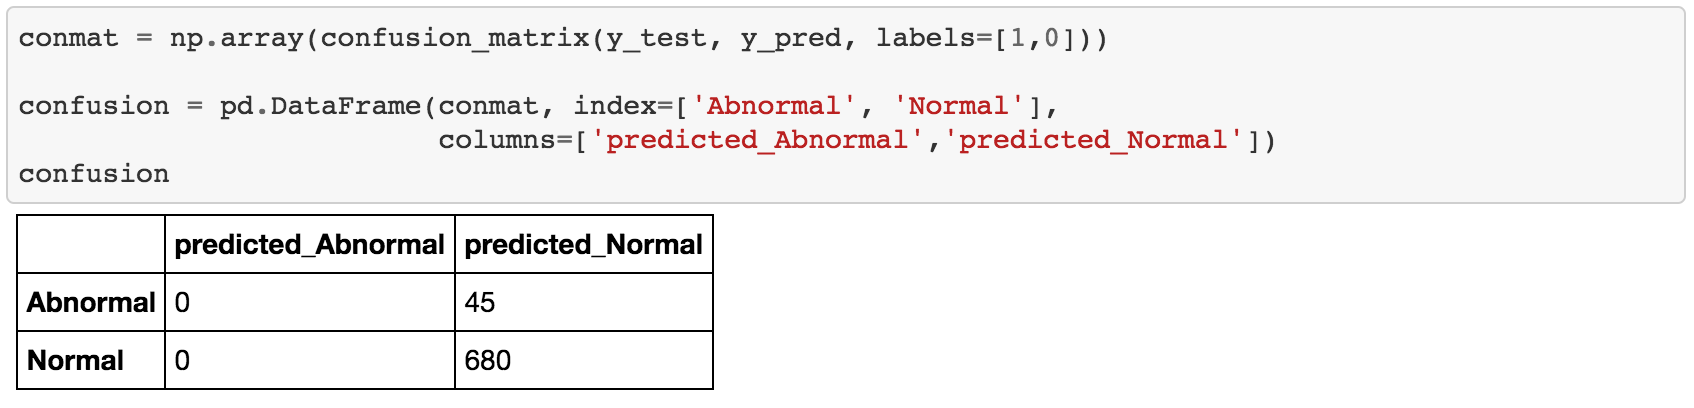
Due to class imbalance we are unable to predict any abnormal sales. In other words there are too few abnormal results. Let’s try lowering the threshold. keep in mind that when we lower the threshold we are increasing our false positive rate.
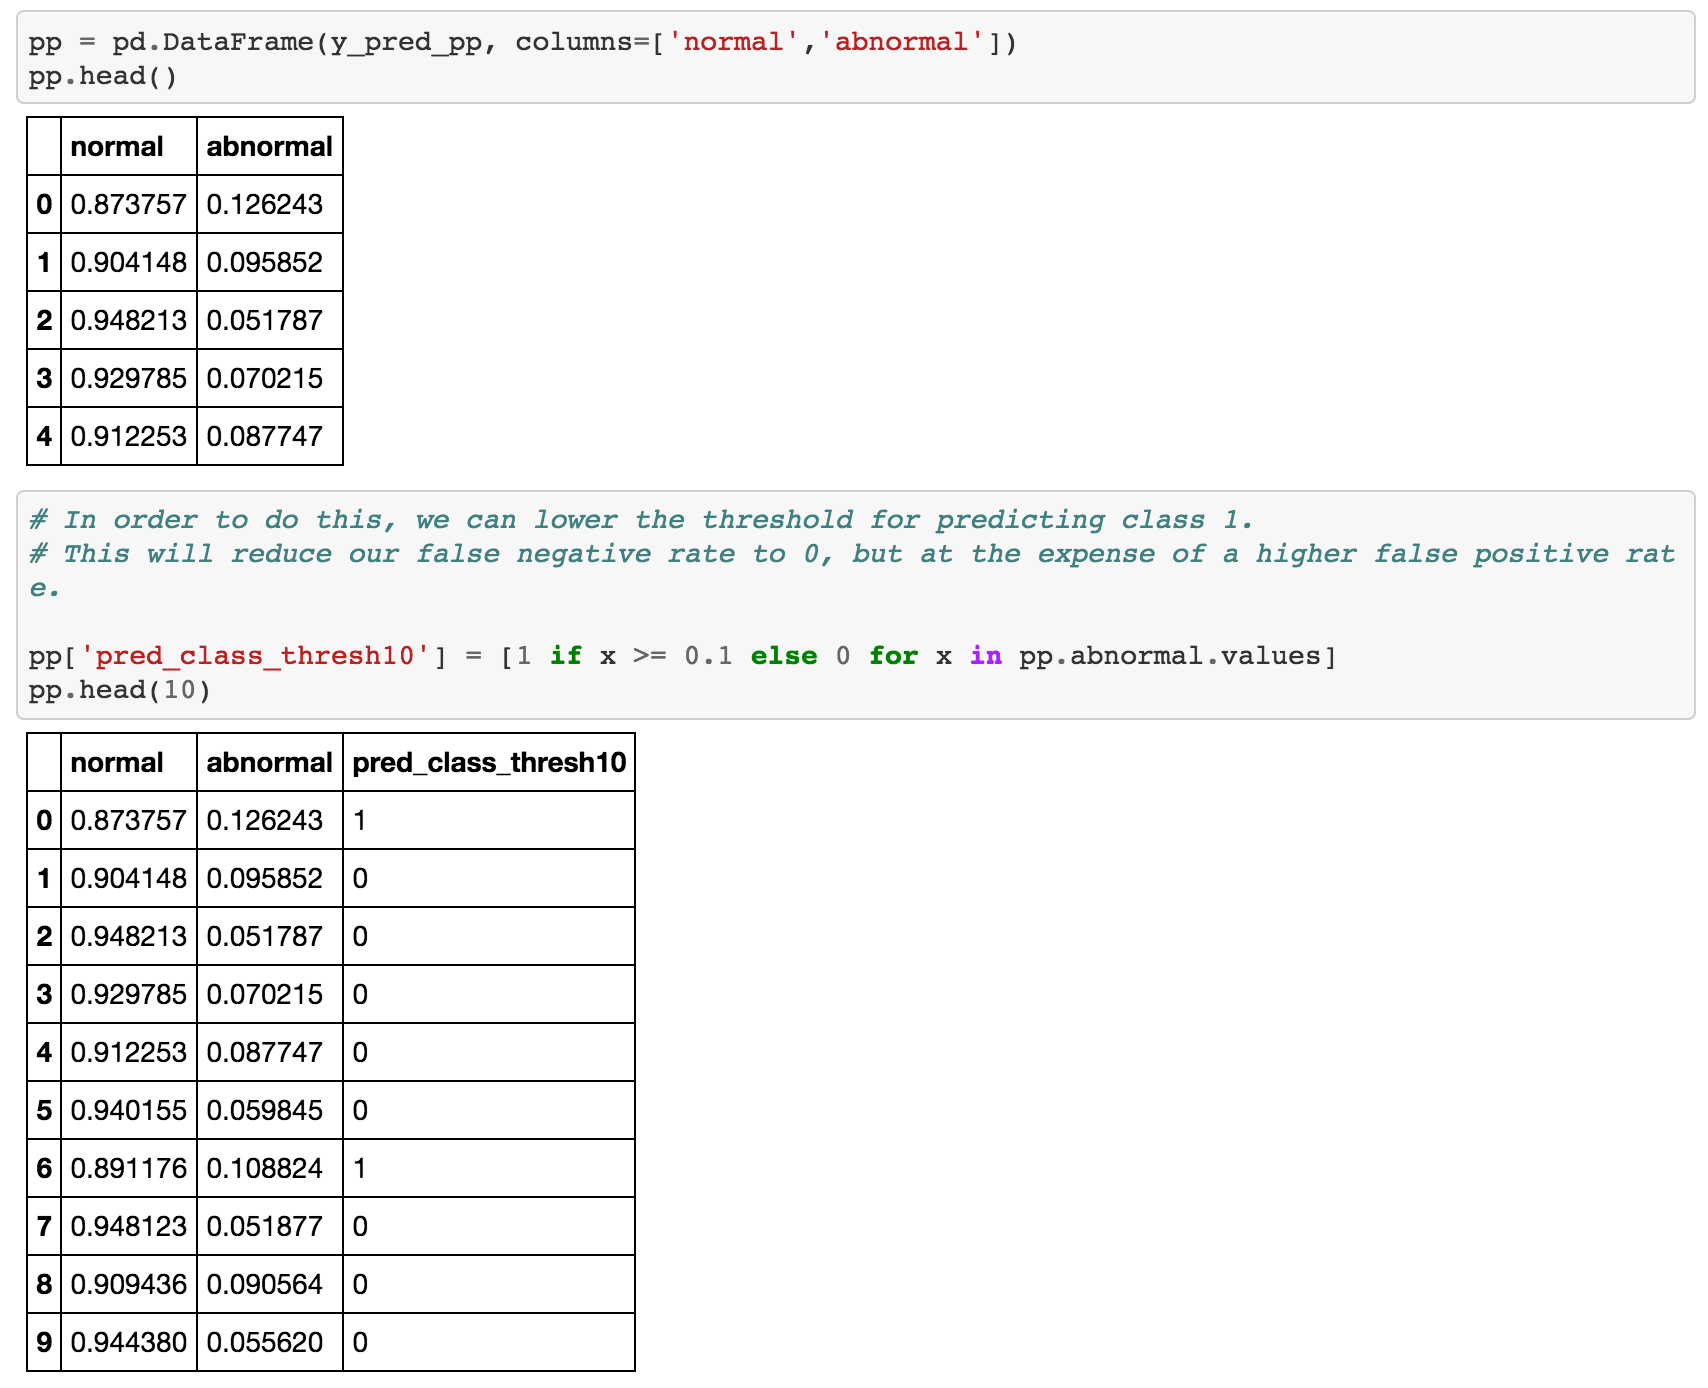
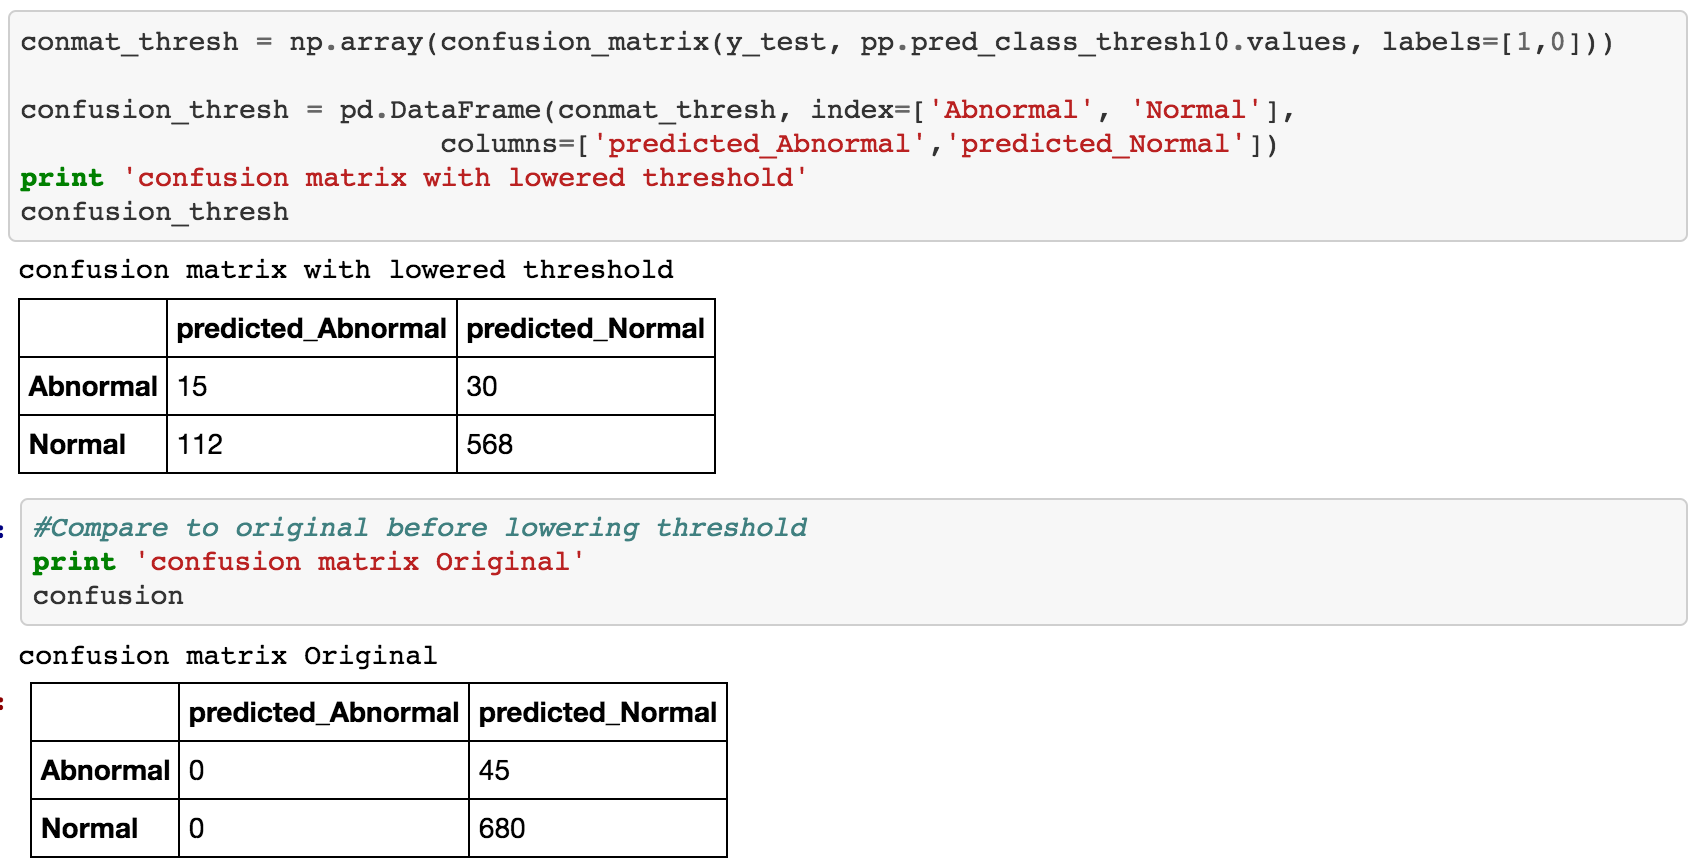
By lowering the threshold we are now able to predict some abnormal sales. The consequnce of this however is that we introduce more false positives. Below we compare the new results with the lowered threshold to the orginal logisitic regression.
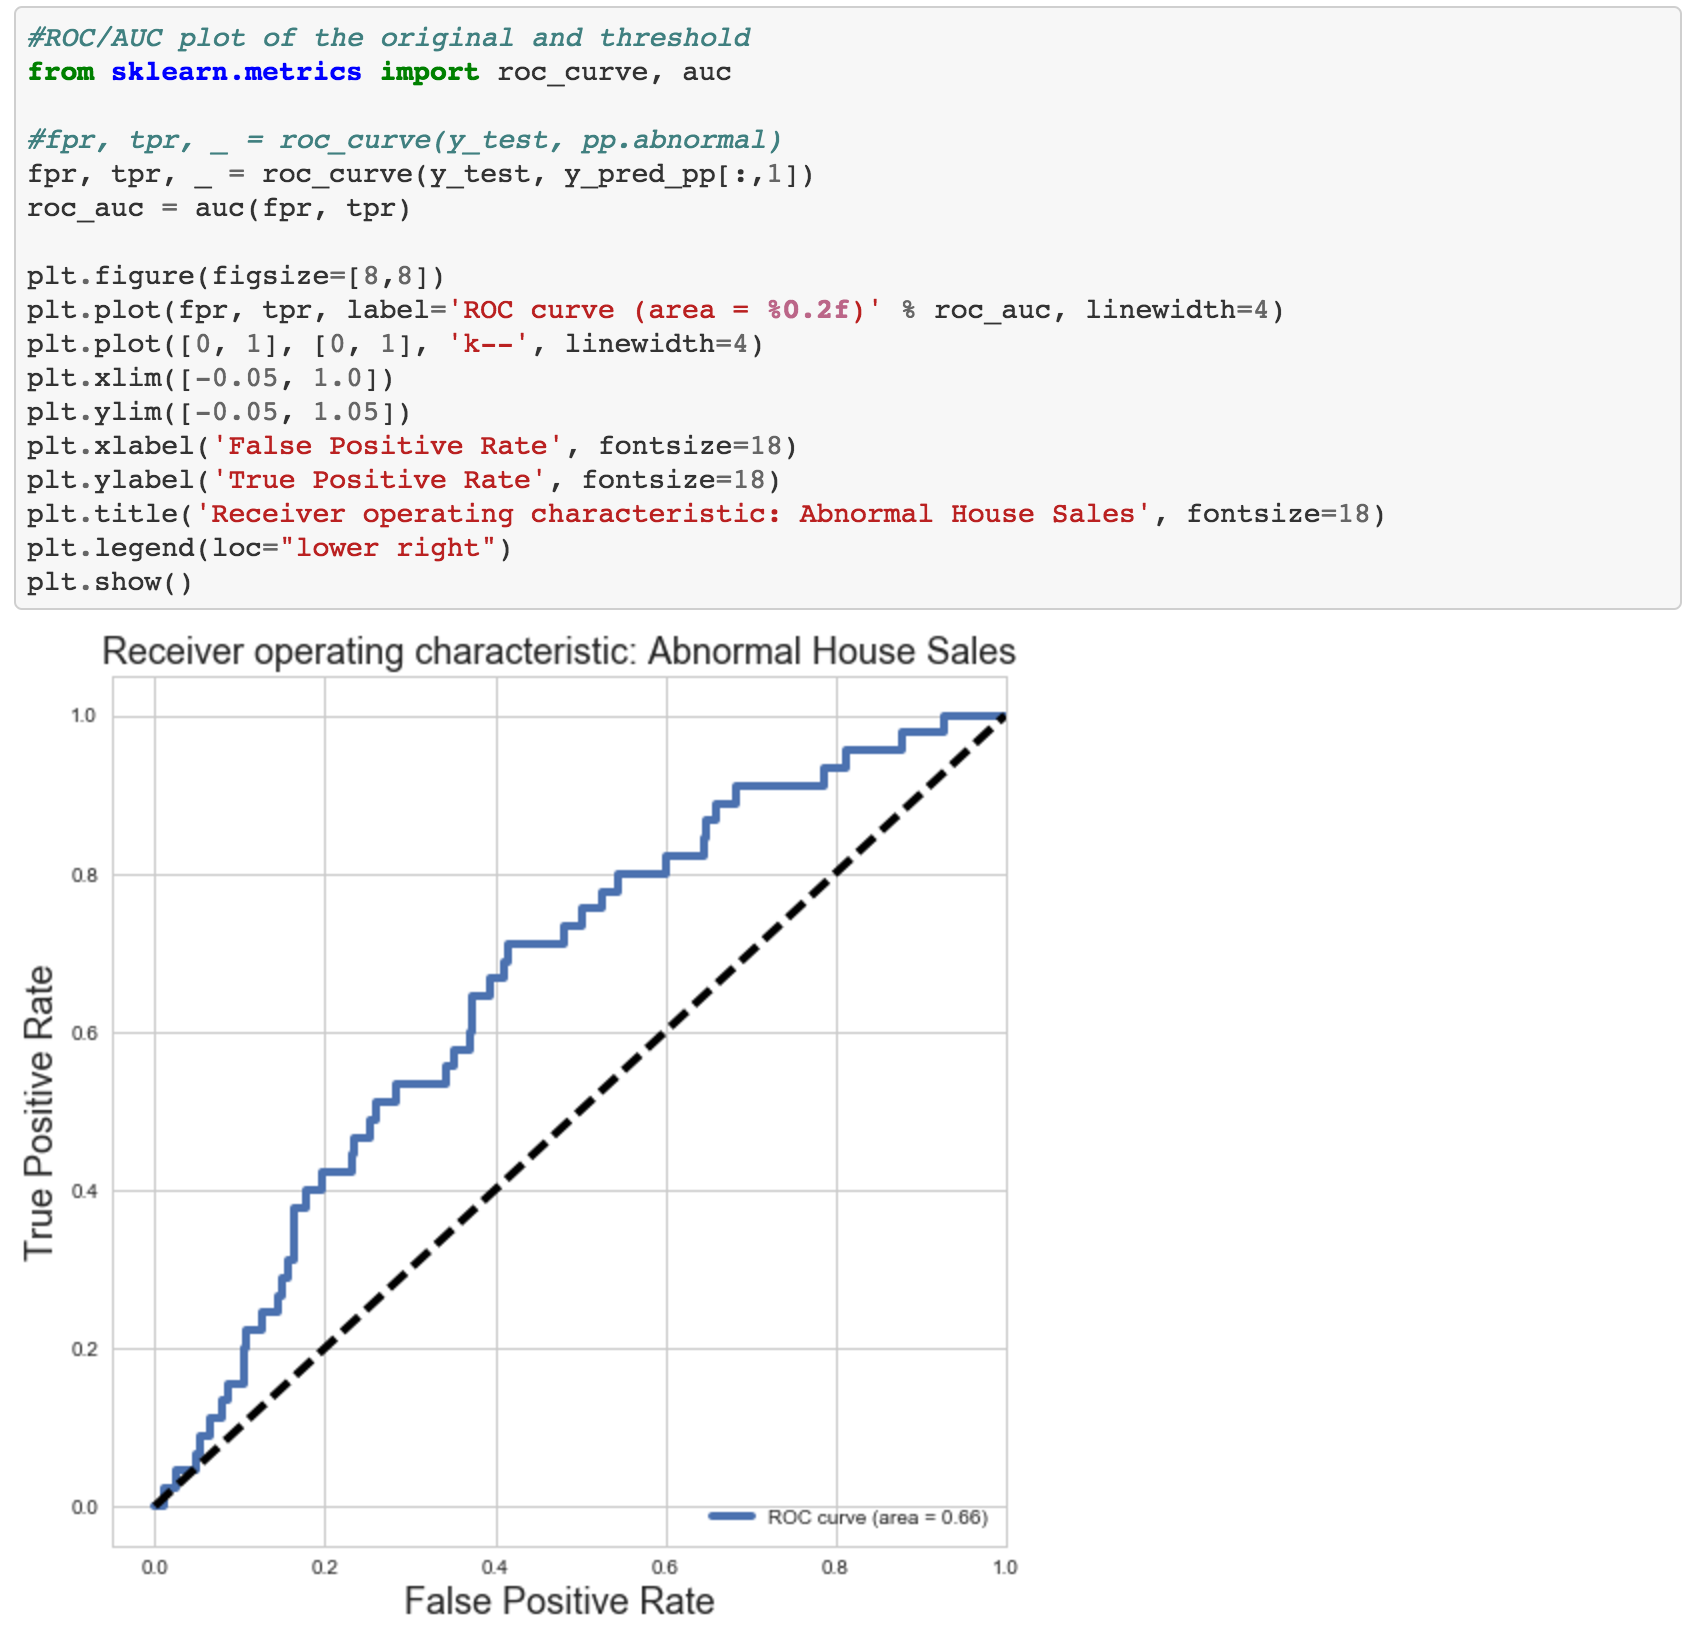
Let’s view this on a ROC/AUC plot
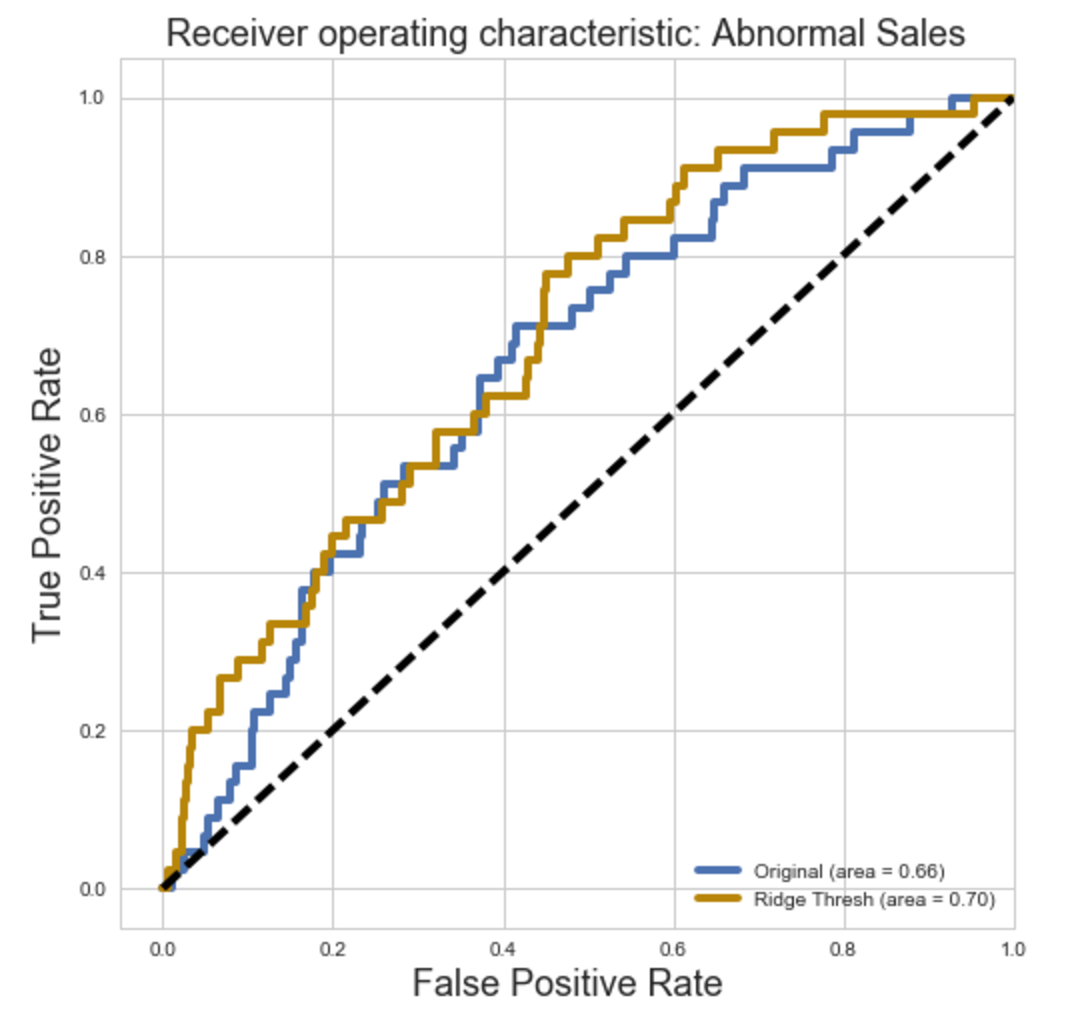
For comparison I also tried using Ridge regression to see if I could improve the results. Below is the ROC/AUC plot comparing logisitic and ridge regression. Using ridge regression we get a slight uplift in the model prediction.
Click here to see the full notebook.